Climate normals
Climate :
Edmonton
Alert
Anchorage
Atlanta
Belize City
Boston
Calgary
Caracas
Chicago
Churchill
Curaçao
Dallas / Fort Worth
Edmonton
Eureka
Fairbanks
Fort-de-France
Halifax
Havana
Houston
Indianapolis
Iqaluit
Juneau
Kansas City
Las Vegas
Los Angeles
Mexico City
Miami
Minneapolis
Montreal Trudeau
Nassau
New Orleans
New York / LaGuardia
Ottawa
Pittsburgh
Pointe-à-Pitre
Prince Patrick Island
Quebec City
Resolute
Sachs Harbour
Salt Lake City
San Francisco
Saskatoon
Seattle / Tacoma
Sint Maarten
St. John's
Tegucigalpa
Thule
Toronto
Vancouver
Winnipeg
Yellowknife
North America
Alabama
Alaska, Anchorage
Alaska, Anchorage Fairbanks
Alaska, British Columbia
Alberta
Arctic Ocean
Arizona
Arkansas
Belize
Bermuda
British Columbia
California, Los Angeles, San Diego
California, North
California, South
Colorado
Costa Rica
Cuba
Dakota
Delaware
Dominican Republic
El Salvador
Florida
Georgia
Guatemala
Haiti
Honduras
Idaho
Illinois
Indiana
Iowa
Jamaica
Kansas
Kentucky
Lesser Antilles
Louisiana
Manitoba
Maritimes
Maryland
Mexico
Mexico, East
Mexico, Northeast
Mexico, Northwest
Mexico, Southwest
Michigan
Minnesota
Mississippi
Missouri
Montana, East
Montana, West
Nebraska
Nevada
New England
New Mexico
New York
Nicaragua
North Atlantic
North Carolina
North Pacific
Northwest Territories
Nunavut
Nunavut, Baffin Island, Ellesmere
Ohio
Oklahoma
Ontario, North
Ontario, South
Oregon
Panama
Pennsylvania
Puerto Rico
Quebec
Quebec, South
Saskatchewan
South America
South Carolina
South Pacific
Tennessee
Texas, East
Texas, South
Texas, West
The Bahamas
Trinidad and Tobago
Utah
Venezuela
Virginia
Washington
Wisconsin
Wyoming
Yukon
Climate : Edmonton, Alberta, Canada Edmonton International Airport
latitude: 53-18N, longitude: 113-35W, elevation: 715 m
Monthly average of the minimum and maximum daily temperatures.°C/°F
Precipitation is any kind of water that falls from the sky as part of the weather. This includes drizzle, rain, hail, sleet, or snow.mm/inch
Monthly average number of hours of sunshine per day.
Climatic data of more than 3000 weather stations.
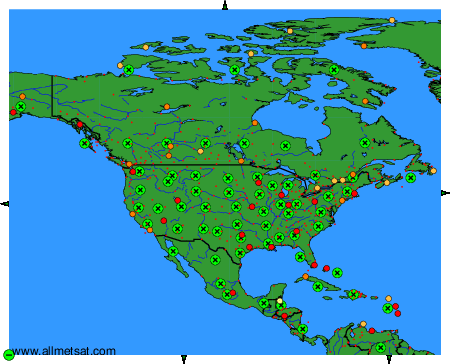
The available stations are represented by yellow and red dots on the map.
Hover mouse over dot to see the name of the station.
Then click to see the data.
To change the map : click on the green buttons with a black cross to zoom in, on the green button with a dash to zoom out, or on the green arrows for adjacent maps.
