METAR-TAF
Airports :
Brisbane
Adelaide
Alice Springs
Auckland
Brisbane
Brunei
Cairns
Christchurch
Darwin
Funafuti
Hagåtña
Honiara
Koror
Kosrae
Majuro
Manila
Melbourne
Nadi
Nouméa / La Tontouta
Pago Pago
Perth
Pohnpei
Port Moresby
Rarotonga
Sydney
Tahiti
Tarawa
Tongatapu
Wallis
Wellington
Weno
Yap
Australia, Oceania
Antarctica
Asia
Australia
Central Pacific
Indian Ocean
Indonesia
Mariana Islands
Melanesia
Micronesia
New Caledonia
New South Wales
New Zealand
New Zealand, North Island
New Zealand, South Island
Northern Territory
North Pacific
Philippines
Queensland
South Australia
South Pacific
Tasmania
Victoria
Western Australia, North
Western Australia, South
Brisbane Airport Brisbane, Australia
latitude: 27-23S, longitude: 153-06E, elevation: 4 m
Current weather observation The report was made 31 minutes ago, at 04:30 UTC
Wind 10 kt from the East
Temperature 28 °C
Humidity 62 %
Pressure 1006 hPa
Visibility 10 km or more
Scattered clouds at a height of 2500 ft
METAR: YBBN 260430Z 10010KT 9999 SCT025 28/20 Q1006
Time: 15:01 (05:01 UTC) Forecast The report was made 2 hours and 57 minutes ago, at 02:04 UTC
Forecast valid from 26 at 03 UTC to 27 at 06 UTC
Wind 14 kt from the East/Southeast
Visibility 10 km or more
Few clouds at a height of 2500 ft Scattered clouds at a height of 3500 ft
From 26 at 0900 UTC
Wind 12 kt from the South/Southeast
Visibility 10 km or more
Scattered clouds at a height of 1500 ft Broken clouds at a height of 2500 ft
light rain showers
From 26 at 1400 UTC
Wind 8 kt from the South/Southwest
Visibility 10 km or more
Scattered clouds at a height of 1300 ft Broken clouds at a height of 2000 ft
light rain showers
From 26 at 2300 UTC
Wind 14 kt from the Southeast
Visibility: 4000 m
Scattered clouds at a height of 4000 ft Broken clouds at a height of 1300 ft
rain showers
TAF: YBBN 260204Z 2603/2706 12014KT 9999 FEW025 SCT035 FM260900 16012KT 9999 -SHRA SCT015 BKN025 FM261400 20008KT 9999 -SHRA SCT013 BKN020 FM262300 13014KT 9999 NSW SCT040 INTER 2609/2623 4000 SHRA BKN013
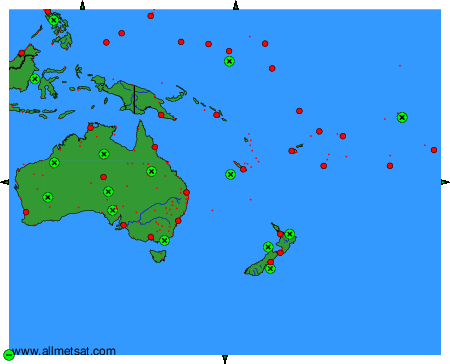
Weather observations and forecasts of more than 4000 airports (METAR and TAF reports).
The available stations are represented by yellow and red dots on the map.
Hover mouse over dot to see the name of the station.
Then click to see weather observations and forecasts.
To change the map : click on the green buttons with a black cross to zoom in, on the green button with a dash to zoom out, or on the green arrows for adjacent maps.
