METAR-TAF
Airports :
San Jose
Alturas
Arcata / Eureka
Auburn
Bishop
Bridgeport
Carson City
Chico
Concord
Crescent City
Davis
Emigrant Gap
Fairfield
Fallon
Fortuna
Fresno
Fresno
Grass Valley
Half Moon Bay
Hanford
Hayward
Hollister
Klamath Falls
Lakeview
Lemoore
Lincoln
Livermore
Lovelock
Madera
Mammoth Lakes
Marin County
Marysville
Marysville / Beale
Merced
Merced
Minden
Modesto
Montague
Monterey
Mountain View
Mount Shasta
Napa
Oakland
Oroville
Palo Alto
Placerville
Porterville
Red Bluff
Redding
Reno
Reno
Sacramento-Executive
Sacramento-Intl.
Sacramento-Mather
Sacramento-McClellan
Salinas
San Carlos
San Francisco
San Jose
San Jose
Santa Rosa
South Lake Tahoe
Stockton
Tonopah
Truckee
Ukiah
Vacaville
Visalia
Watsonville
Winnemucca
California, North
California, South
Idaho
Nevada
North America
Oregon
San José International Airport San Jose, California, United States
latitude: 37-21-33N, longitude: 121-55-27W, elevation: 59 ft
Current weather observation The report was made 51 minutes ago, at 12:53 UTC
Calm wind
Temperature 61 °F
Humidity 82 %
Pressure 30.00 in. Hg
Visibility: 10 miles
Few clouds at a height of 1000 ft Few clouds at a height of 10000 ft
METAR: KSJC 011253Z 00000KT 10SM FEW010 FEW100 16/13 A3000 RMK AO2 SLP157 T01560133
Time: 06:44 (13:44 UTC) Forecast The report was made 2 hours and 24 minutes ago, at 11:20 UTC
Forecast valid from 01 at 12 UTC to 02 at 12 UTC
Wind 3 mph from variable directions
Visibility: 6 miles
Clear sky
Temporary
Broken clouds at a height of 700 ft
From 01 at 1900 UTC
Wind 7 mph from the North/Northwest
Visibility: 6 miles
Clear sky
From 01 at 2200 UTC
Wind 16 mph from the North/Northwest
Visibility: 6 miles
Clear sky
From 02 at 0600 UTC
Wind 6 mph from variable directions
Visibility: 6 miles
TAF: KSJC 011120Z 0112/0212 VRB03KT P6SM SKC TEMPO 0112/0116 BKN007 FM011900 33006KT P6SM SKC FM012200 33014KT P6SM SKC FM020600 VRB05KT P6SM SKC
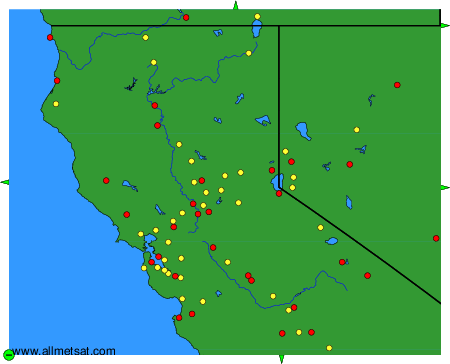
Weather observations and forecasts of more than 4000 airports (METAR and TAF reports).
The available stations are represented by yellow and red dots on the map.
Hover mouse over dot to see the name of the station.
Then click to see weather observations and forecasts.
To change the map : click on the green buttons with a black cross to zoom in, on the green button with a dash to zoom out, or on the green arrows for adjacent maps.